Knowledge Base

This could be a critical issue when people started to migrate from current PCIe Gen3 environment to the newest PCIe Gen4, especially for those who want to take advantages as first movers. Imagine that we have invested so much in adapting new technology, and the performance does not scale-up as it should be, we would try our best to figure out the root cause of it. But how?
There are many possible causes to the problem; it could be that the new configurations are not optimized, or the AI programming has not been modified to fit the new configurations…etc. In order to find the root issue, the first thing to do is to collect the GPU and IO performance data.
Usually, an IT worker would have to write a program that reads the performance of GPU and data transfers happening in the servers, and then record the data for analysis. In some cases, IT workers might even detach a GPU device from chassis and test it somewhere else to collect its performance data. It takes a lot of effort to complete this stage, and there are risks of data loss and device damage due to human misoperations, which could potentially lead to a consequence that we cannot afford.
H3 platform has created a hardware and software integrated solution to reduce the effort to collect all performance related information, bringing users closer to solving the GPU scaling issues, while mitigating the risks of human made mistakes. We have discussed the H3 platform GPU chassis that achieves GPU pooling previously, and briefly introduced the H3 management center UI (a reference link to the Balanced GPU solution post). But that is not all about it, users are also able to monitor the performance of GPUs in the chassis through the management center UI and obtain any performance data they need with the built-in GPU monitoring tools.
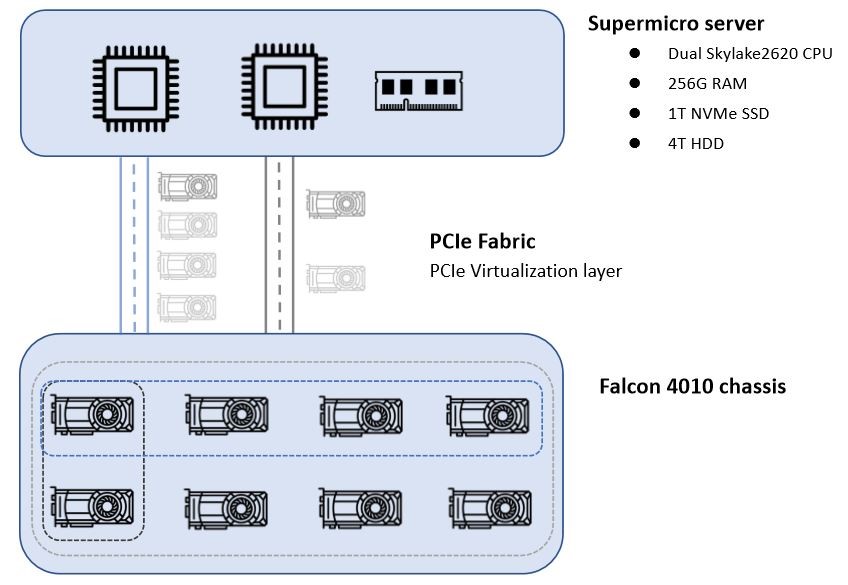
One of our clients migrated their AI environment from the original PCIe gen 3 GPU solution to our PCIe Gen 4 solution. The new configuration consist of a supermicro server with dual Intel Skylake 2620v4 CPU, 256G RAM, 1T NVMe SSD, and 4T HDD, and the H3 Falcon 4010 composable GPU solution. The GPU resources in Falcon 4010 can be assigned dynamically to the Supermicro server on demand.
Figure 1. Assign 2 GPUs, 4 GPUs, or 8GPUs to the host according to resources needed.
However, our customer soon realized that their AI performance does not scale up as in the original PCIe Gen 3 configuration, in fact, the performance became even slower than before. This decline in performance might be related to the CPU, memory, GPU, or storage issue, and they normally would have to examine every aspect until the issue is found.
Figure 2. AI training performance comparison.
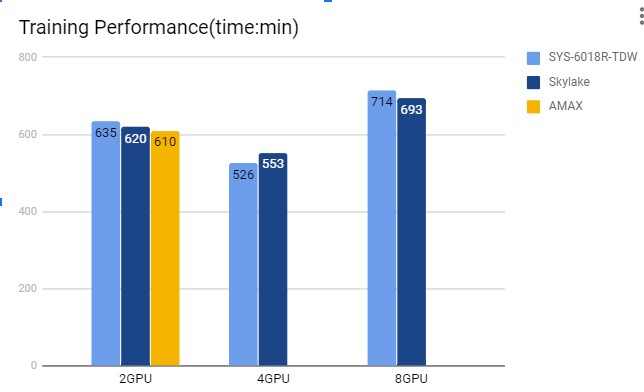
Figure 3. Statistics of 15 round genome sequence training performance under 2-GPU, 4-GPU, and 8-GPU configuration.
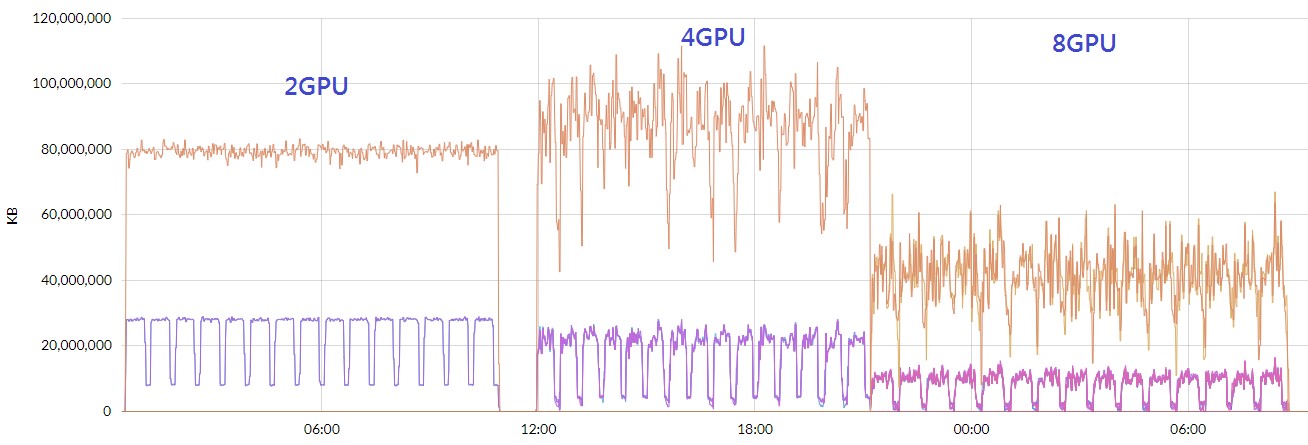
First step we did was to open H3 management center to look at the IO performance and the utilization rate of each GPU in use. We ran 15 cycles and got the result shown in the diagram blow. The brown trend represents IO performance and the purple represents the GPU utilization rate. Notice that IO performance declined significantly under 8 GPU configuration compared to the 2 and 4 GPUs and that the GPU utilization rate also declined.
Then, we looked at the data transmission speed shown on GPU provision page on H3 management center.
Figure 4. IO performance available on H3 management center.
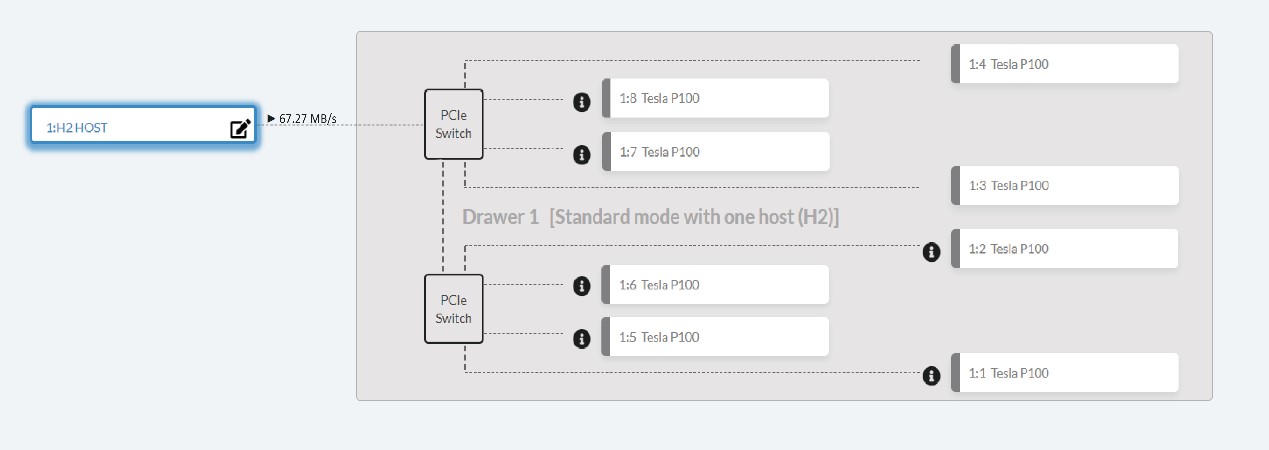
The transmission speed between host and the switch appears to be lower than expected given an NVMe SSD device. We went on to look at the performance data from the host end, checking the GPU utilization rate by nVidia SMI and IO performance from Linux system IO.
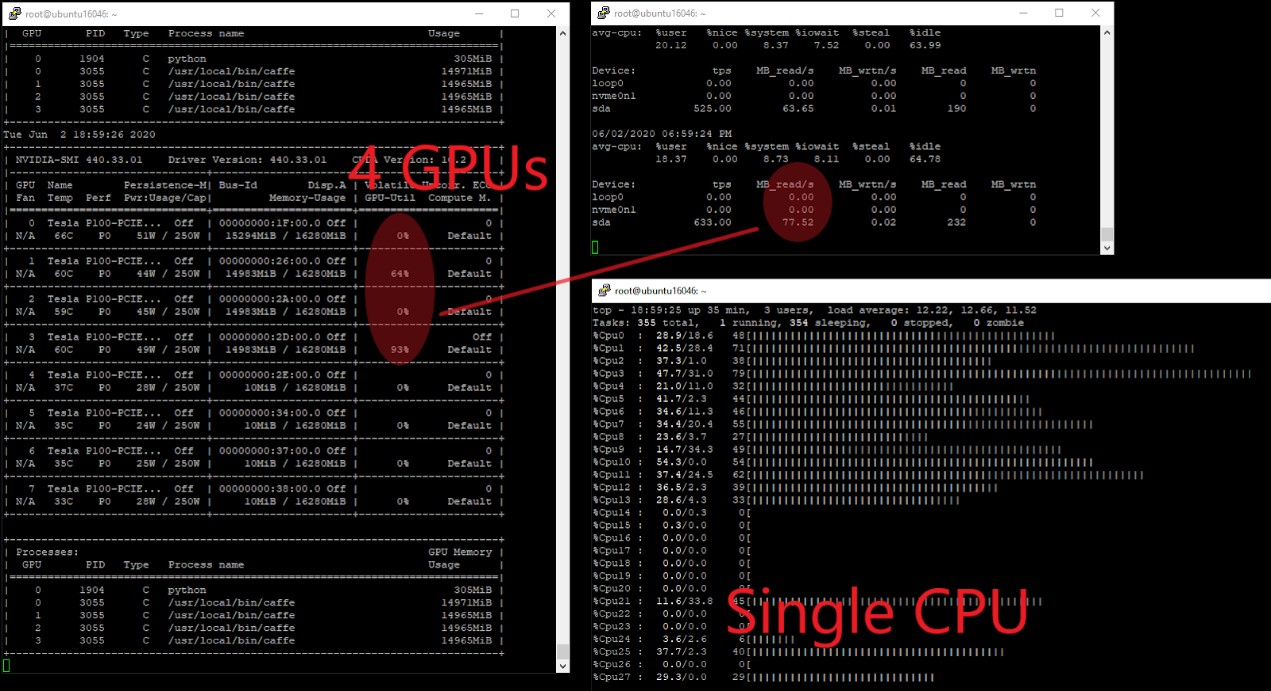
Under 4 GPU configuration, The GPU utilization rate are 0%, 64%, 0% and 93% in respect, and the IO performance is 77.52MB/s. However, the NVMe performance is 0 MB/s, so we assumed that the data is stored in and fed from HDD rather than NVMe SSD device.
Figure 5. IO performance from host end under 4-GPU configuration.
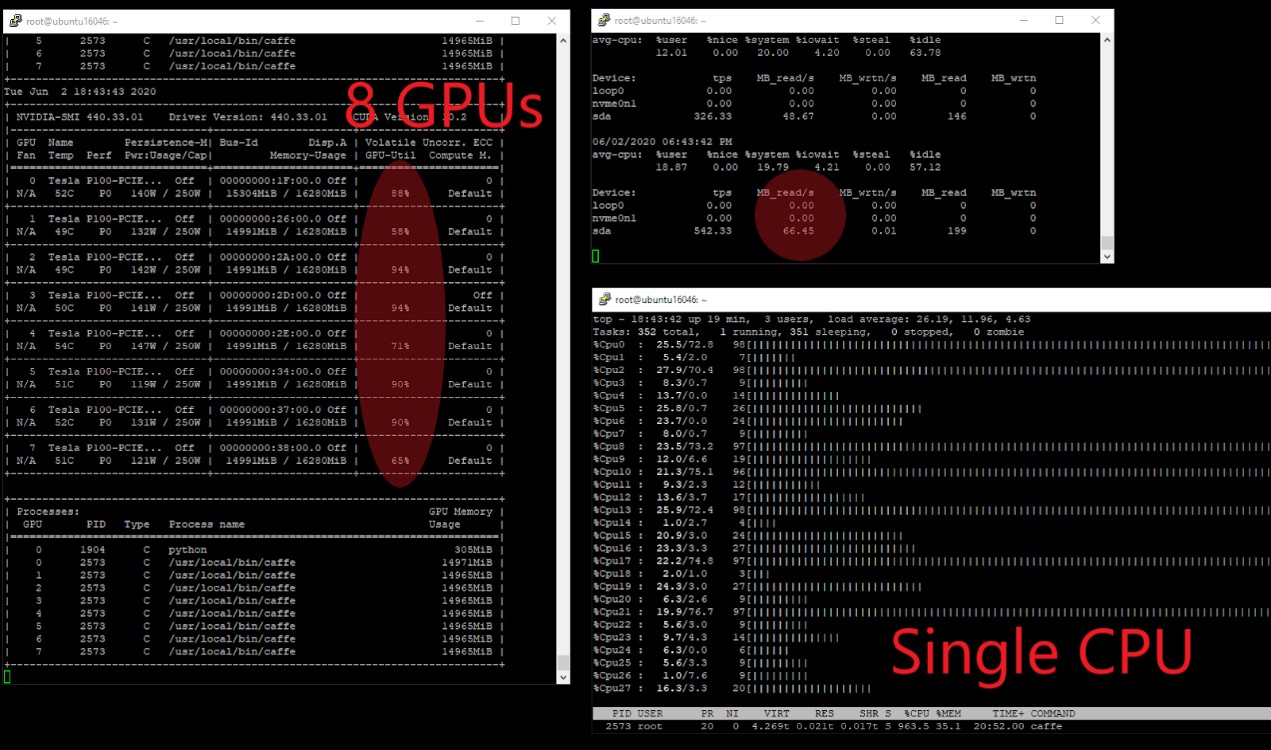
Under 8 GPU configuration, the GPU utilization of 8 GPUs were among 58%~ 94% while the IO performance remains low at 66.45 MB/s. Again, we observed the NVMe performance to be 0 MB/s. Noticed that the GPU utilization rates are above 50%, indicating GPUs are not responsible for the decline in training performance.
Figure 6. IO performance from host end under 8-GPU configuration.
Up to this point, we can almost conclude that the decline is due to the IO bottleneck, and it is likely to be caused by their programming. We discussed the findings with the programmers and suggested them to modify the NVMe SSD installed in the GPU chassis as IO device, then we run the performance test again with 8 GPU configuration same as above. The new performance result is shown in the following diagram.
Figure 7. New IO performance from host end under 8-GPU configuration.
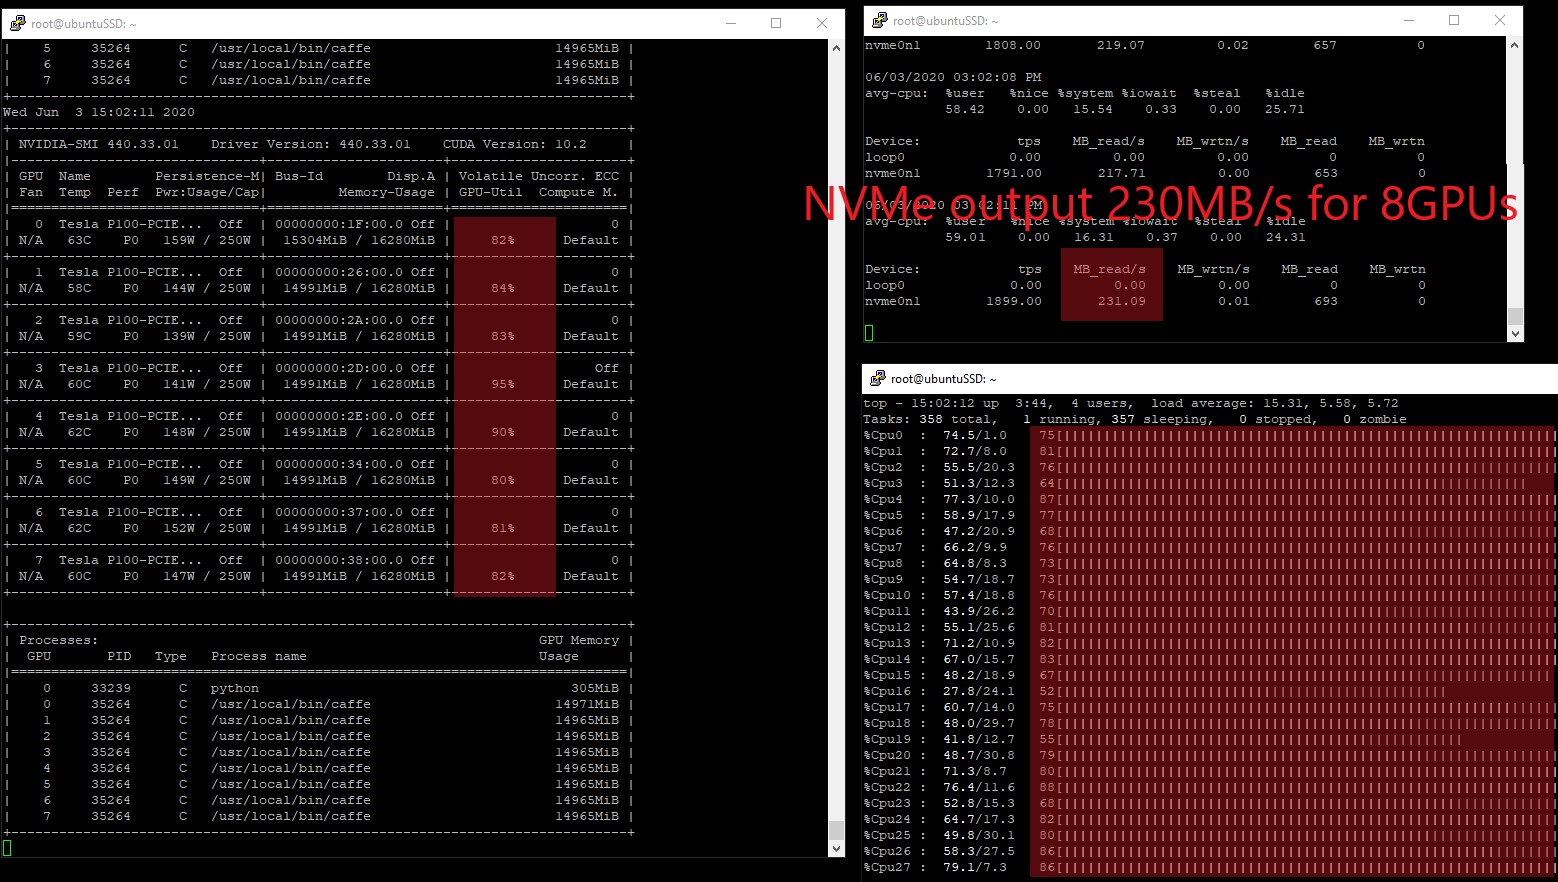
The new utilization rate of the 8 GPUs raised to 80%~ 95% and the IO performance significantly increased to 231.09 MB/s while the CPU utilization rate remains steady at 41%~ 79%. The issue is pretty much resolved here.
According to our client, they have never got rid of a performance related issue this quickly before, the time spent on the entire problem-solving process is reduced by 70%. Honestly, any experienced engineer would be able to point out the key issue easily, but they would have spent much more time and effort on collecting the performance data. Nonetheless, with the data being ready on H3 management center, engineers can jump directly to analysis and problem-solving stage rather than spending much time on preparations.